I am the daughter of three different engineers: one architectural, one aeronautical, and one electrical. As a kid I became fascinated with pictures in old college textbooks like Strength of Materials, Thickness Design, Electrical Engineering, Differential Equations, Visions of Symmetry and others that peppered the bookshelf. Though I couldn’t really fully understand or “read” them, the drawings of basic principles of stability, strength, structure, design, materials, systems, and transmission seemed to impart some kind of implicit knowledge about the world and the rules that guide it.
Electric circuit diagrams have long been my favorite. Their simple flows and cryptic labels, shapes and lines, as well as the metaphor they brought to mind of an invisible, bright, powerful, mysterious string of electrons flowing through lines and circuits and transducers, powering up and down, a system controlling the flow and intensity of power, was very powerful to me.
I have often returned to these diagrams and enjoyed dreaming of what they could mean if they represented something else or imagining the interesting ways the metaphor of electricity and the flow of power can apply to all sorts of other systems. Combining this interest in electricity, power, and diagrams, in my graduate career I’ve found myself digging into systems theory, the idea that phenomena can be described as systems where a change in one part reflects a change in another, since the system reflects each part’s relationship to the environment around it.
To that end, I discovered Sven Rasegard’s systems discussion of the realm of scientific information production and its relationship to mankind. His systems approach yielded this drawing of the critical subsystems in the communication of scientific information.
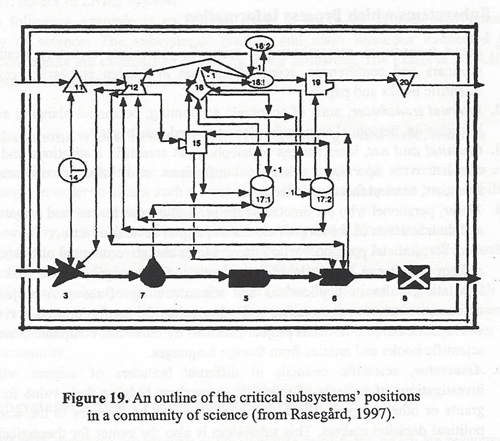
Rasgard’s diagram shows a system of input transducers, decoders and encoders, deciders, memory, an ingestor, converter, producer, associator, etc. — each representing, for example, the people who make decisions, produce information, store artifacts, and relay units of natural research within the system of science-making. He shows how science and man are an interconnected “web of systems and social conventions.”
I began to think of information as flowing through society from one point to another. For instance, Axel Bruns’ ideas of produsage – where people both create and consume information in a cyclical fashion (as opposed to a distinction between producers and users), got me thinking about how this information might move, exactly, through the modern networked information landscape. Specifically, I am interested in how scientific information flows from the ivory tower to Everyman’s dinner table conversation, so I drew the following flow chart to see if it made sense to represent it this way. This flow chart represents a combination of the flow of science information as a pathway espoused by Massiamo Bucchi and others and draws on explanations based in information science theories for how people seek and use information for identity formation.
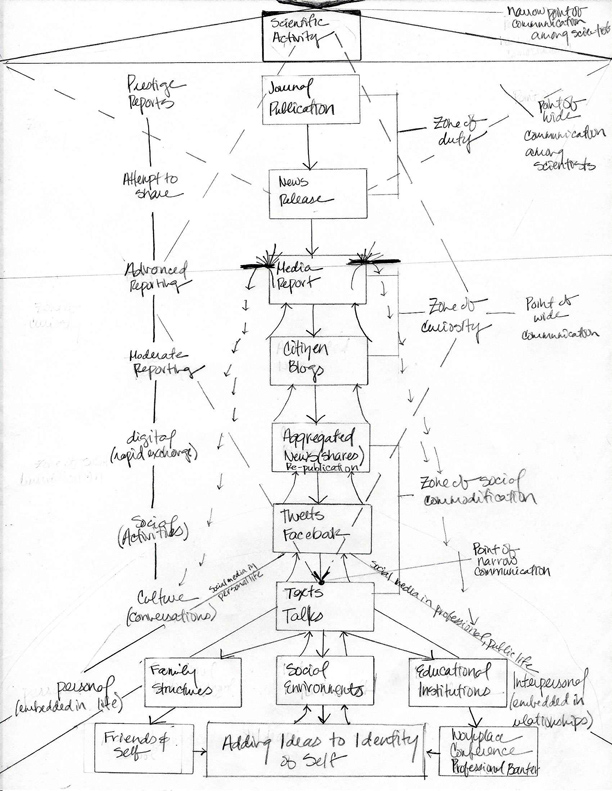
In this diagram, information produced in the scientific community flows down through journal publication into the mass media and then on to blogs, social media and into families and the lives and state of knowledge (Belkin, 1982) of people who encounter the information. As the arrows flowing upward indicate, I wanted to ask the question: Does information flowing in this linear fashion (spreading out laterally only at the top in the scientific environment and the bottom in the cultural environment) ever flow back up the chain and influence the scientific community after being processed through the cultural environment?
I wanted to understand more about this cultural environment (shown in the bottom half of the above diagram as everything outside the scientific community). Again looking to Rasegard I was able to learn about the effects of different influences in the system on the socio-cultural environment with regard to information. He calls the cultural environment the “superstructure of the human society” and borrows from Karl Popper’s three worlds idea to explain that the social, political and judicial environment have significant impacts on the cultural environment, and these three impacts are part of a system, together with the three worlds (products of mankind, subjective experiences, physical objects), that produces paradigms, societal opinions, and result in behavioral attitudes and actions – possible actual change.
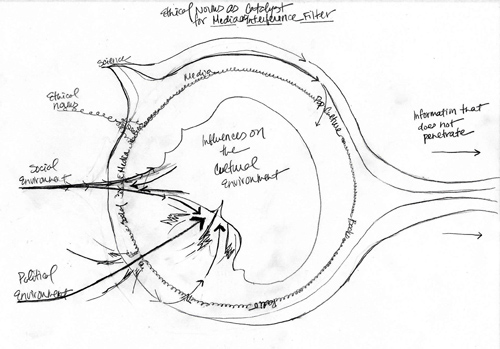
I configured the following flow of three diagrams in order to show the cultural environment/superstructure of society depicted as:
1) a perfect flow of ideas flowing in and out, affected (but not necessarily filtered) by a living media membrane;
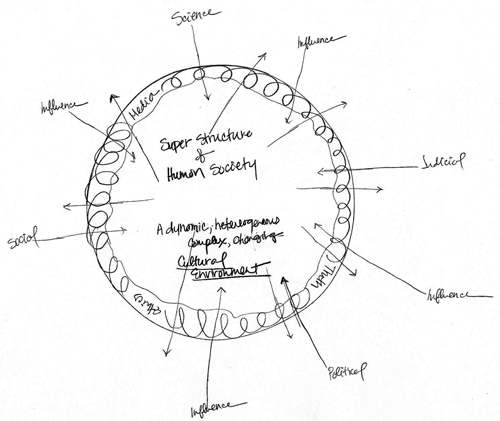
2) an environment reflecting the impact of the influence of various realms of activity including the social, political and judicial environments, with political information having the strongest impact;
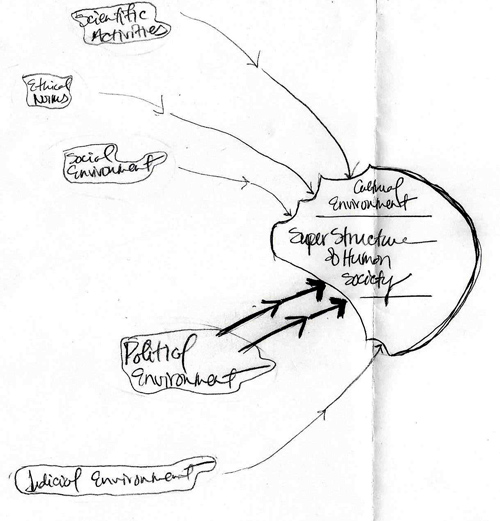
and 3) the impact of those influences coinciding with a breech in the media membrane as well as a violent cultural reaction where those influences augment each other as they impact the cultural environment:
Diagramming in this way has led me to a greater understanding of my readings, and pursuing systems theory has led me to continue to diagram ideas in interesting ways that both simplify the information and leave room for development based on what “works” and doesn’t in the drawn model.
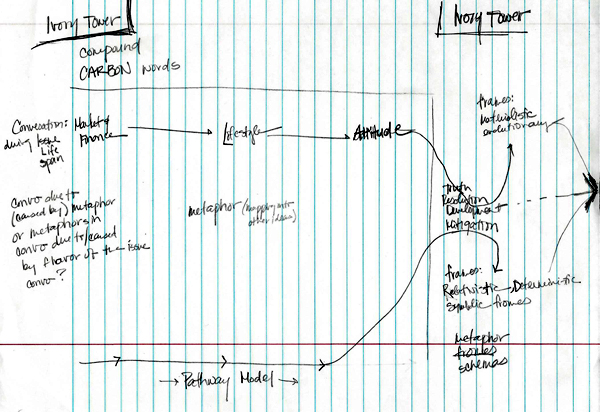
For example, when I read a paper about the evolution of the conversation about the term “carbon” online, I drew a map of its argument, which shows the conversation following the pathway model of scientific communication. The paper by Koteyko, Thelwall, and Nerlich (2009) showed the conversation about carbon and the associated carbon-compounds as moving from market and finance- to lifestyle- to attitude-based terms over the course of its development and, regarding frames used, splitting into two camps, where half use a materialistic and evolutionary frame while the other half use relativistic/deterministic and symbolic frames.
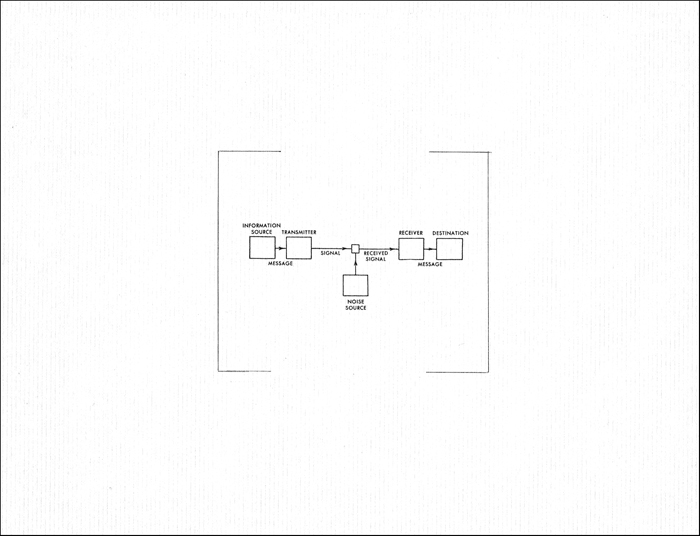
This kind of flow of science information moving through culture is intriguing to me, and I find that I really enjoy drawing the flow of information, considering specific characteristics of a given issue, and determining how it moves. When I discovered Claude Shannon’s Mathematical Theory of Information and his simple diagram of an information transmission system, I wanted to fit it into my developing ideas.
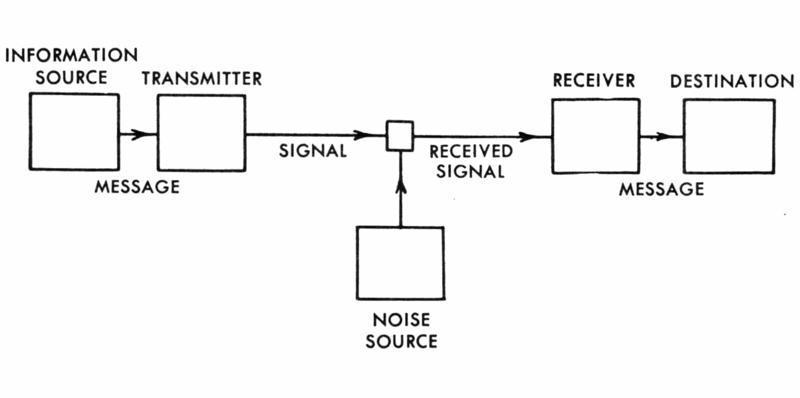
At first, I thought Shannon’s transmission system might correlate to the information flow shown above from the science community down through various levels of media and social media until it reaches individuals. If I replace these transmission system parts with journalistic ones a comparison might look like the following. The journalist is the information source, the media they publish in is the transmitter, the signal is the information article, the receiver is the destination, and the mind of the audience is the destination.
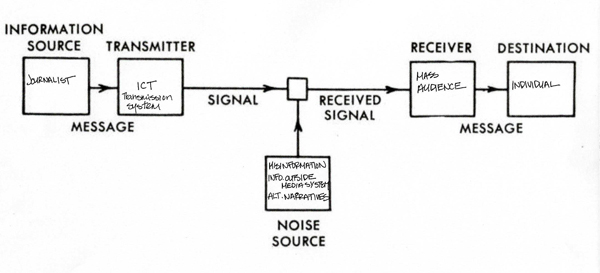
In such an example, a noise source might be misinformation or missing information in the information article, which means the message is damaged as the signal moves through the “transmission” system of mass media. In the wider view, the “transmitter” would be the transmission system itself – technology used by journalists (sources) to send a signal (article) to a receiver (mass audience) and destination (individual).
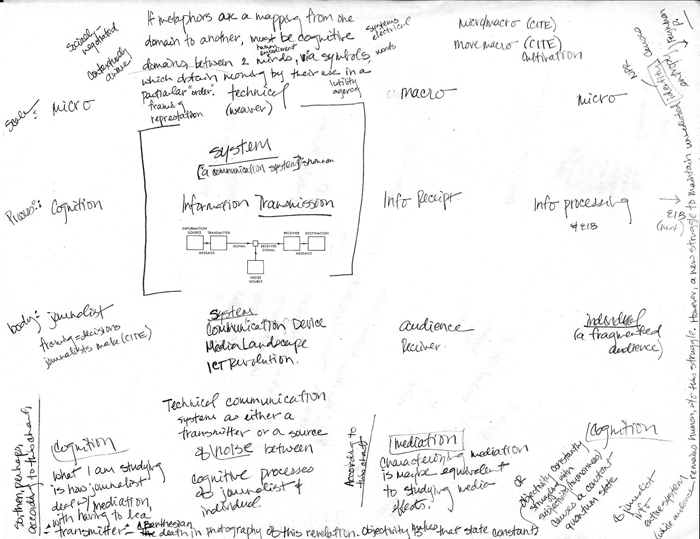
However, parts of this analogy are questionable since the effect on an electric system of noise might not be quite the same as the effect of misinformation on the media system. So, I began to lean more toward simply situating Shannon inside of a larger system, and focusing on what it is that gets truth from a journalist to a person.
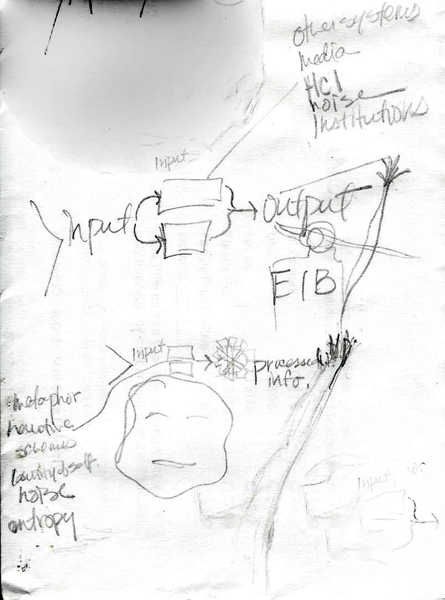
If the transmission system ruled by Shannon’s Mathematical Theory of Information is the ICT system used to move information from the journalist to the receiver, then we can consider that relationship a technology-mediated relationship. Here, I sought to fill in the parts of the media system, with the ICT system situated in the middle:
And here is a cleaner version of the same diagram with Shannon’s theory situated in the middle:
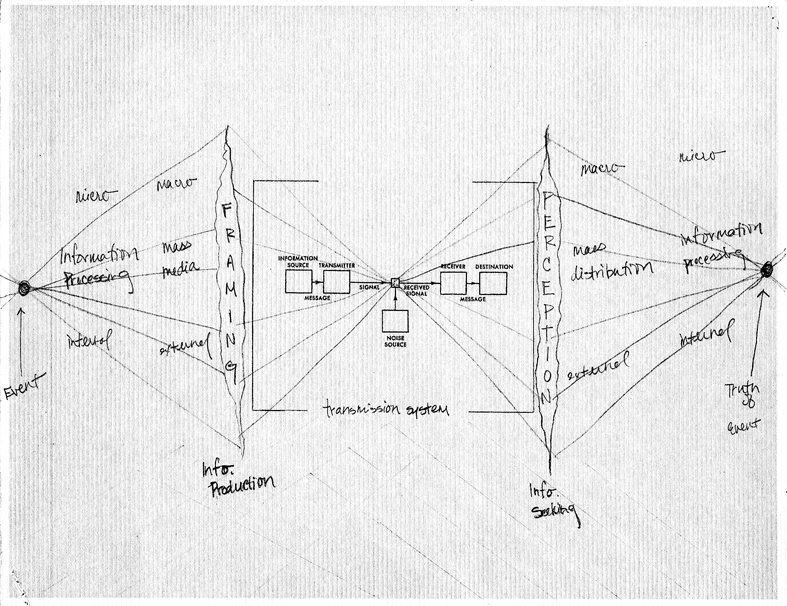
Here, an event occurs and is processed by a journalist, first on a micro scale inside his brain and then on a macroscale when it is prepared for publication. During that process, journalistic framing is used to make what the journalist has learned through the process of processing the information more palatable to the intended audience. The framed information enters the transmission system where it is compressed. The information fans out to a macro-scale again once it reaches the audience, who processes the information through a filter of perception in the mind of the information seeker – so the information will hit each person differently, as shown it narrows to a microscale again during human information processing and to a point if the truth of the event identical to the event, is what has been communicated.
However, this model fails instantly in the designation of the noise source as a point of convergence and then emergence of the information, going from a micro to a macro scale or narrow to wide scope. While it is convenient to position the center as a point of this kind of change, the noise source might not be the best center for the theory. On the other hand, drawing the event at the beginning and the truth of event at the end as identical “points” at each end of the system might be a useful addition.
In many ways, I began to think of information communicated from a journalist to an audience member as a mapping between cognitive domains, as George Lakoff says metaphors do. Similar to metaphors, framing is a way of short-cutting the system of understanding between people. If the information landscape is a grid of intersections and points of information, then connections between points in the grid are points of connection between information sources and receivers.
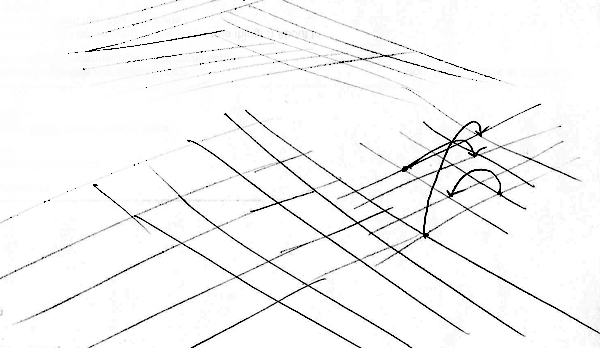
Further, consider a thinking person who is looking for information, reaching into the information landscape to grasp a piece of information they seek.
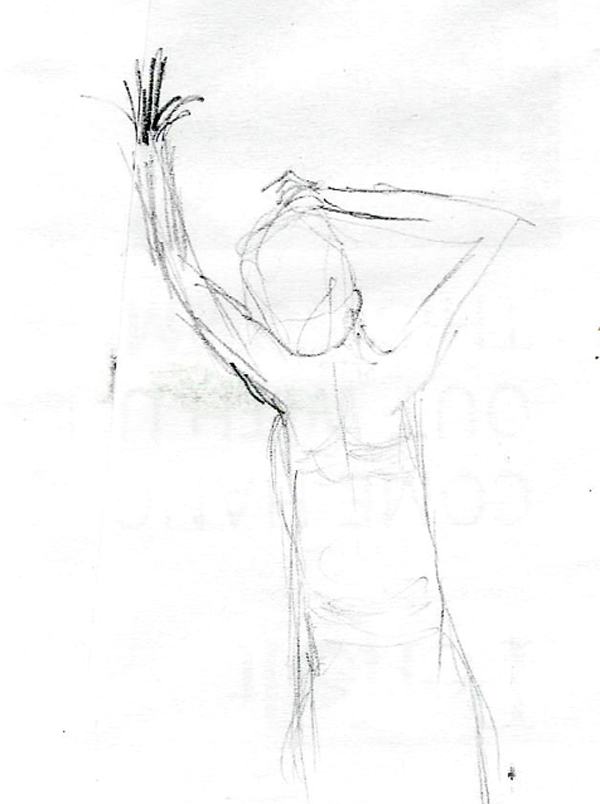
And consider that the person who is looking for information is a player in two different systems at once – the system of information processing and embodied information behavior that happens inside the human mind, and the system of institutions outside the person which determine the information environment that is outputting messages for the information-seeker to find, as here:
Can these two systems be mapped over the model of mass media (including journalist as source, ICT as transmission, article as message, audience as receiver, and individual as destination) that I developed in this line of reasoning via diagram? The next step is to find answers to this question by further theoretical and diagrammatic exploration, adding pieces of the literature in as I find them and adjusting my models with each new piece.